
Key Points
- K-means clustering is an unsupervised machine learning algorithm that partitions a dataset into k clusters based on the similarity of the data points.
- The elbow method is a technique that helps you find the optimal value of k for k-means clustering.
- The elbow method involves running k-means clustering on a range of k values and calculating a cluster quality measure for each value.
- The cluster quality measure is usually the within-cluster sum of squares (WCSS), the sum of squared distances between each data point and its cluster centroid.
- The elbow method plots the cluster quality measure against k and looks for an "elbow" in the curve.
- The elbow point is where the cluster quality measure stops decreasing rapidly as you increase k.
- The value of k at the elbow point is the optimal number of clusters for the dataset.
- The
Elbow method could be better, as sometimes there may not be a clear elbow point or more than one elbow point in the curve.
- In such cases, you may need to use other methods or criteria to choose the best value of k.
K-means clustering is one of the most popular unsupervised machine learning techniques. It partitions a dataset into k groups based on the similarity of the data points.
But how do you choose the best value of k for your dataset? One way to do that is by using the elbow method.
The elbow method is a simple and intuitive way to find the optimal number of clusters for k-means clustering. It involves running k-means clustering on a range of k values and calculating a cluster quality measure for each value.
Then, you plot the measure against k and look for an "elbow" in the curve. The elbow point is where the cluster quality stops improving significantly as you increase k. That's the optimal value of k for your dataset.
In this article, you will learn how to use the elbow method to find the best k for k-means clustering in RStudio. You will also learn how to implement and visualize the elbow method with examples.
What is K-Means Clustering?
K-means clustering is an unsupervised machine learning algorithm that partitions a dataset into k clusters based on the similarity of the data points.
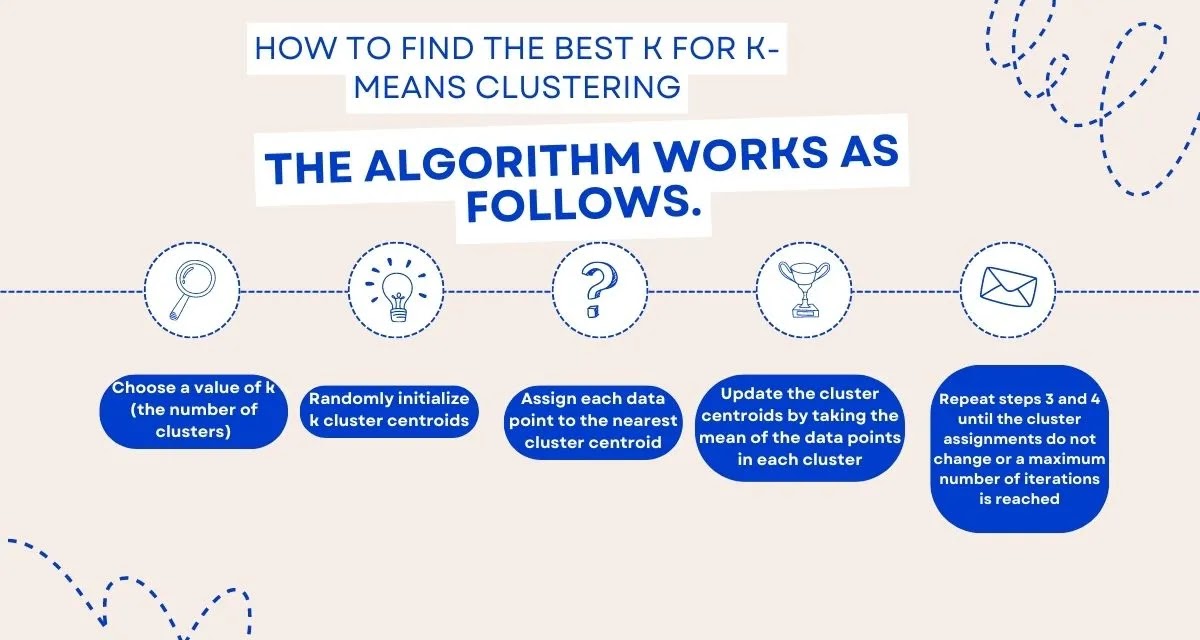
The algorithm works as follows:
- Choose a value of k (the number of clusters)
- Randomly initialize k cluster centroids
- Assign each data point to the nearest cluster centroid
- Update the cluster centroids by taking the mean of the data points in each cluster
- Repeat steps 3 and 4 until the cluster assignments do not change or a maximum number of iterations is reached
K-means clustering aims to minimize the within-cluster sum of squares (WCSS), the sum of squared distances between each data point and its cluster centroid. A lower WCSS means the data points are more compact and similar within each cluster.
What is the Elbow Method?
The elbow method is a technique that helps you find the optimal value of k for k-means clustering. As you increase k, the WCSS will decrease because the clusters will be more homogeneous. However, at some point, increasing k will not result in a significant improvement in WCSS. That's where you should stop and choose k as your optimal number of clusters.
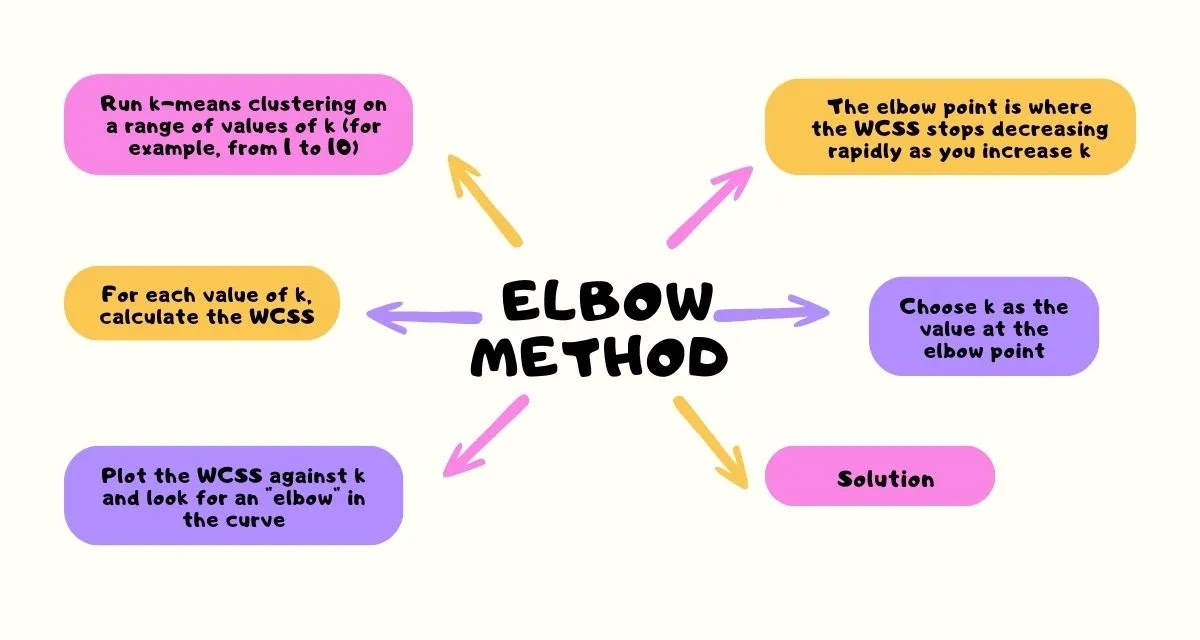
To use the elbow method, you need to do the following steps:
- Run k-means clustering on a range of values of k (for example, from 1 to 10)
- For each value of k, calculate the WCSS
- Plot the WCSS against k and look for an "elbow" in the curve
- The elbow point is where the WCSS stops decreasing rapidly as you increase k
- Choose k as the value at the elbow point
The elbow method is called so because the plot of WCSS versus k looks like an arm bending at an elbow. The figure below shows an example of an elbow plot.
This example shows that as you increase k from 1 to 10, the WCSS decreases rapidly until k = 3. After that, the WCSS decreases slowly and smoothly as you increase k. The elbow point is at k = 3, meaning 3 is this dataset's optimal number of clusters.
Using the Elbow Method in R for Optimal K-Means Clustering
To implement and visualize the elbow method in RStudio, you need to use two packages: cluster and factoextra. The cluster package provides functions for clustering analysis, such as kmeans and wss. The factoextra package provides functions for visualizing clustering results, such as fviz_nbclust.
First, you need to install and load these packages:
# Install packages
install.packages("cluster")
install.packages("factoextra")
# Load packages
library(cluster)
library(factoextra)
Create or Load a dataset
Next, you must create or load a dataset you want to cluster. For this example, we will use the iris dataset, which contains 150 observations of four variables: sepal length, sepal width, and petal length. The dataset also has a fifth variable called Species, which is the class label of each observation. We will ignore this variable for clustering purposes.
# Load the iris dataset
data(iris)
# View the first six rows of the dataset
head(iris)
Sepal.Length Sepal.Width Petal.Length Petal.Width Species 1 5.1 3.5 1.4 0.2 setosa 2 4.9 3.0 1.4 0.2 setosa 3 4.7 3.2 1.3 0.2 setosa 4 4.6 3.1 1.5 0.2 setosa 5 5.0 3.6 1.4 0.2 setosa 6 5.4 3.9 1.7 0.4 setosa
Run k-means Clustering
Then, you need to run k-means clustering on a range of values of k and calculate the WCSS for each value. You can use the wss function from the cluster package to do that. The wss function takes a data matrix and a vector of cluster assignments as inputs and returns the WCSS as output.
# Define a range of values of k
set.seed(123)
# function to compute total within-cluster sum of square
wss <- 1:10="" 2-15="" and="" clusters="" compute="" extract="" for="" function="" iris="" k.values="" k="10" kmeans="" map_dbl="" nstart="10" plot="" pre="" to="" tot.withinss="" wss="" wss_values="">
Plot the WCSS values against the values of k
Finally, you need to plot the WCSS values against the values of k and look for an elbow point in the curve. You can use the fviz_nbclust function from the factoextra package to do that. The fviz_nbclust function takes a data matrix and a clustering method as inputs and returns a plot of cluster quality measures against different values of k.
plot(k.values, wss_values,
     type="b", pch = 19, frame = FALSE,
     xlab="Number of clusters K",
     ylab="Total within-clusters sum of squares")
# Plot the WCSS values against the values of k using the elbow method
fviz_nbclust(iris[, -5], kmeans, method = "wss") 

From the plot, you can see an elbow point at k = 3, meaning 3 is the optimal number of clusters for this dataset.
Example: Elbow Method for K-Means Clustering on the Mall Customers Dataset
To illustrate the elbow method for k-means clustering, let's use another example dataset: the mall customers dataset. This dataset contains information about 200 customers who visited a mall. The variables are:
- CustomerID: a unique identifier for each customer
- Gender: the gender of the customer (Male or Female)
- Age: the age of the customer
- Annual Income (k$): the annual income of the customer in thousands of dollars
- Spending Score (1-100): a score assigned by the mall based on the customer's spending behaviour
The dataset can be downloaded from here.
The goal is to cluster the customers based on their annual income and spending score and find the optimal number of clusters using the elbow method.
Load the Data Set
First, let's load and view the dataset:
# Load the dataset
mall <- all_customers.csv="" dataset="" first="" head="" mall="" of="" pre="" read.csv="" rows="" six="" the="" view="">
Output:
CustomerID Gender Age Annual.Income..k.. Spending.Score..1.100. 1 1 Male 19 15 39 2 2 Male 21 15 81 3 3 Female 20 16 6 4 4 Female 23 16 77 5 5 Female 31 17 40 6 6 Female 22 17 76
Run k-means clustering
Next, let's run k-means clustering on a range of values of k and calculate the WCSS for each value:
# Define a range of values of k
k_range <- 1:10="" an="" and="" annual="" append="" c="" calculate="" centers="k," cluster="" clustering="" data="" empty="" for="" in="" income="" initialize="" k-means="" k="" k_range="" km_result="" kmeans="" loop="" mall="" matrix="" nstart="10)" of="" on="" only="" over="" pre="" result="" run="" score="" spending="" store="" the="" to="" using="" value="" values="" vector="" wcss="" wss="" wss_value="" wss_values="">
Plot the WCSS
Finally, let's plot the WCSS values against the values of k and look for an elbow point in the curve:
# Plot the WCSS values against the values of k using the elbow method
fviz_nbclust(mall[, c(4,5)], kmeans, method = "wss")
Output:
From the plot, you can see an elbow point at k = 5, which means that 5 is the optimal number of clusters for this dataset.

Conclusion
In this article, you learned how to use the elbow method to find the best k for k-means clustering in RStudio. You also learned how to implement and visualize the elbow method with examples.
The elbow method is a simple and intuitive way to find the optimal number of clusters for k-means clustering. It involves running k-means clustering on a range of k values and calculating a cluster quality measure for each value. Then, you plot the measure against k and look for an "elbow" in the curve. The elbow point is where the cluster quality stops improving significantly as you increase k.
The elbow method could be better, as sometimes there may not be a clear elbow point or more than one elbow point in the curve. In such cases, you may need to use other methods or criteria to choose the best value of k.
However, the elbow method is still a valuable and widely used technique for finding the optimal number of clusters for k-means clustering.
FAQs
Q: What is k-means clustering?
A: K-means clustering is an unsupervised machine learning algorithm that partitions a dataset into k clusters based on the similarity of the data points.
Q: What is WCSS?
A: WCSS represents the within-cluster sum of squares, a cluster quality measure. It is the sum of squared distances between each data point and its cluster centroid.
Q: What is the elbow method?
A: The elbow method is a technique that helps you find the optimal value of k for k-means clustering. It involves running k-means clustering on a range of values of k and calculating WCSS for each value. Then, it plots WCSS against k and looks for an "elbow" in the curve. The elbow point is where WCSS stops decreasing rapidly as you increase k.
Q: How do you implement and visualize the elbow method in RStudio?
A: To implement and visualize the elbow method in RStudio, you need to use two packages: cluster and factoextra. The cluster package provides functions for clustering analysis, such as kmeans and wss. The factoextra package provides functions for visualizing clustering results, such as fviz_nbclust.
Q: What are the advantages of the elbow method?
A: The advantages of the elbow method are:
- It is simple and intuitive to use
- It does not require any prior knowledge or assumptions about the data
- It can help you choose the best value of k for your dataset
Q: What are the limitations of the elbow method?
A: The limitations of the elbow method are:
- It may not always produce a clear elbow point, or there may be more than one elbow point in the curve
- It may not work well for datasets that have complex or irregular shapes
- It may be affected by the random initialization of cluster centroids
Q: What are some alternatives to the elbow method?
A: Some alternatives to the elbow method are:
- The silhouette method, which measures how well each data point fits in its cluster and how well it is separated from other clusters
- The gap statistic method, which compares the WCSS of the actual data with the WCSS of randomly generated data
- The Bayesian information criterion (BIC) or the Akaike information criterion (AIC), which balances the trade-off between model complexity and fit
Q: How do you interpret the elbow plot?
A: To interpret the elbow plot, look for an "elbow" in the curve, where WCSS stops decreasing rapidly as you increase k. The value of k at the elbow point is your dataset's optimal number of clusters.
Q: How do you choose the range of values of k for the elbow method?
A: There is no definitive rule for choosing the range of values of k for the elbow method. However, a common practice is to start from 1 and increase k until you reach a reasonable upper limit, such as 10 or 15. You can also use your domain knowledge or intuition to guide your choice.
Q: How do you validate your clustering results?
A: To validate your clustering results, you can use various methods, such as:
- Visualizing your clusters using scatter plots, box plots, histograms, etc.
- Comparing your clusters with external labels or criteria, if available
- Evaluating your clusters using internal or external indices, such as WCSS, silhouette score, Rand index, etc.
Do you need help with a data analysis project? Let me assist you! With a PhD and ten years of experience, I specialize in solving data analysis challenges using R and other advanced tools. Reach out to me for personalized solutions tailored to your needs.
